
TL;DR
- cbBTC tracks BTC almost exactly (mean −0.002% over the last year). WBTC averaged 0.16% below BTC and was more than 0.10% below on 62% of days. tBTC averaged −0.10% and was the noisiest. Circle’s new cirBTC has been at par for its first month.
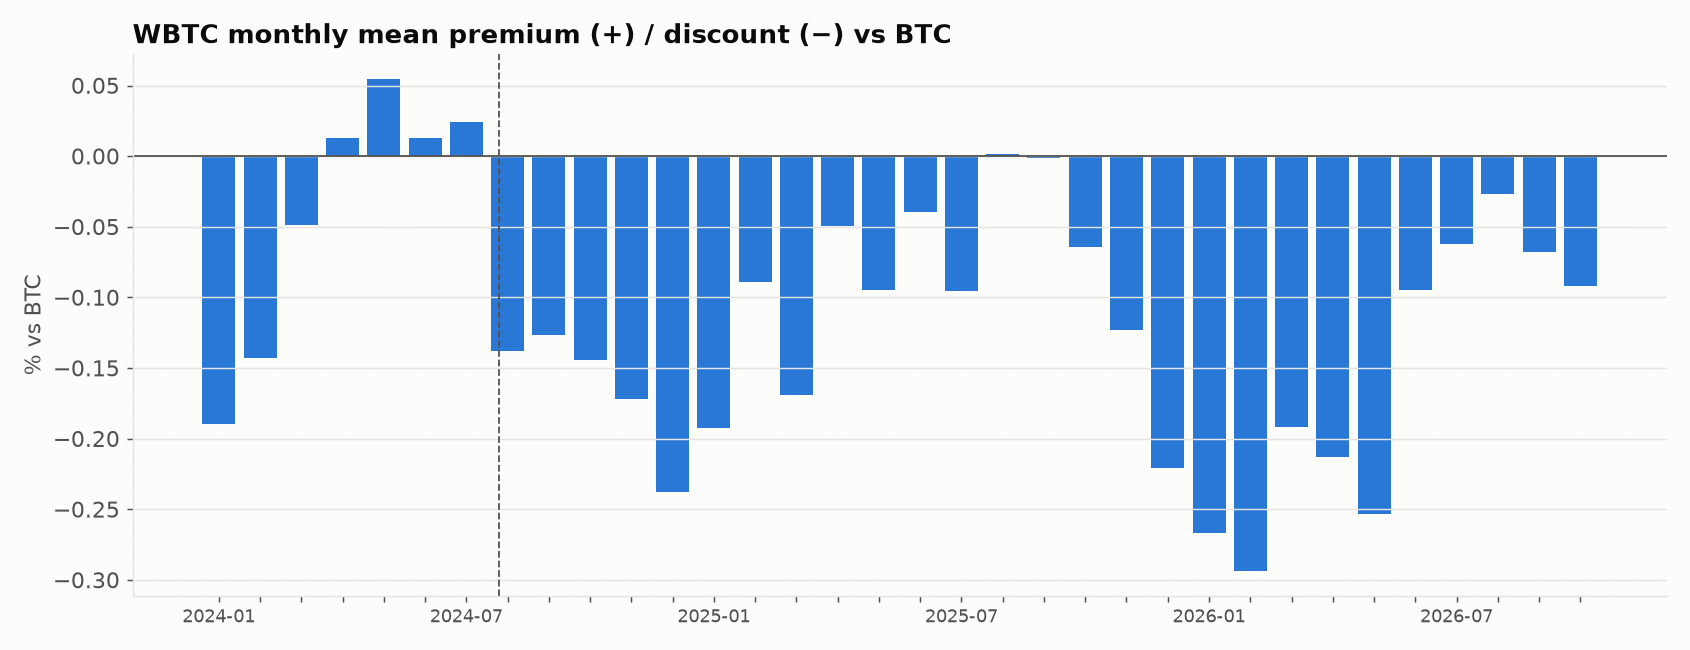
- WBTC’s discount has been there almost every month since August 2024, the month BitGo announced the custody deal with Justin Sun’s BiT Global.
- USDC was the tightest stablecoin (−0.017% vs the dollar). USDT ran a small persistent discount (−0.05%). LUSD traded above its peg, +0.47% on average, with a peak of +2.55% in March 2026.
- EURC (−0.05%) and Société Générale’s EURCV (−0.08%) both sit a little below the euro. Frankencoin averages par with the Swiss franc but is noisy, from −0.58% to +0.99% on single days.
I wanted to see how far the tokens I actually use drift from what they track, so I pulled a year of DEX prices on Ethereum for four wrapped bitcoins (WBTC, cbBTC, tBTC, cirBTC) and six stablecoins (USDT, USDC, LUSD, EURC, EURCV and Frankencoin). Each one is compared to its own underlying: BTC, the dollar, the euro or the Swiss franc. Comparing a euro stablecoin to USD would just give you a chart of EUR/USD.
How I measured it
Two short Python scripts pull one price per day per token from the DeFiLlama coins API. DeFiLlama derives these from on-chain DEX liquidity, so this is what the market pays for the token, not what you get when you redeem it with the issuer.
- Wrapped BTC is divided by DeFiLlama’s BTC price for the same moment. cirBTC is too new for DeFiLlama’s history, so for it the script uses daily closes of its most liquid pool on GeckoTerminal.
- USD stablecoins are compared to 1.00.
- EURC, EURCV and Frankencoin are divided by the hourly EUR/USD or CHF/USD rate from Yahoo Finance, taken from the same hour as the token price. Weekends are left out for these three, because FX markets are closed and the reference would be stale.
DeFiLlama’s prices have a small bias of their own. USDC, which should be the cleanest, comes out about 0.02% below the dollar almost every day. I’d treat differences below roughly 0.03% as noise. A daily snapshot also hides intraday depegs, so treat the extremes below as lower bounds.
Wrapped bitcoin vs BTC
| Token | Mean | Median | Std dev | Worst day | Days below −0.10% |
|---|---|---|---|---|---|
| WBTC | −0.157% | −0.152% | 0.135% | −0.68% | 62% |
| tBTC | −0.105% | −0.078% | 0.221% | −0.94% | 45% |
| cbBTC | −0.002% | −0.004% | 0.065% | −0.54% | 5% |
| cirBTC (31 days) | +0.005% | −0.007% | 0.066% | −0.14% | 3% |
Last 365 days. At today’s BTC price of about $82,000, a 0.16% discount is roughly $130 per bitcoin, or $13,000 on a 100 BTC position if you have to sell WBTC on a DEX.
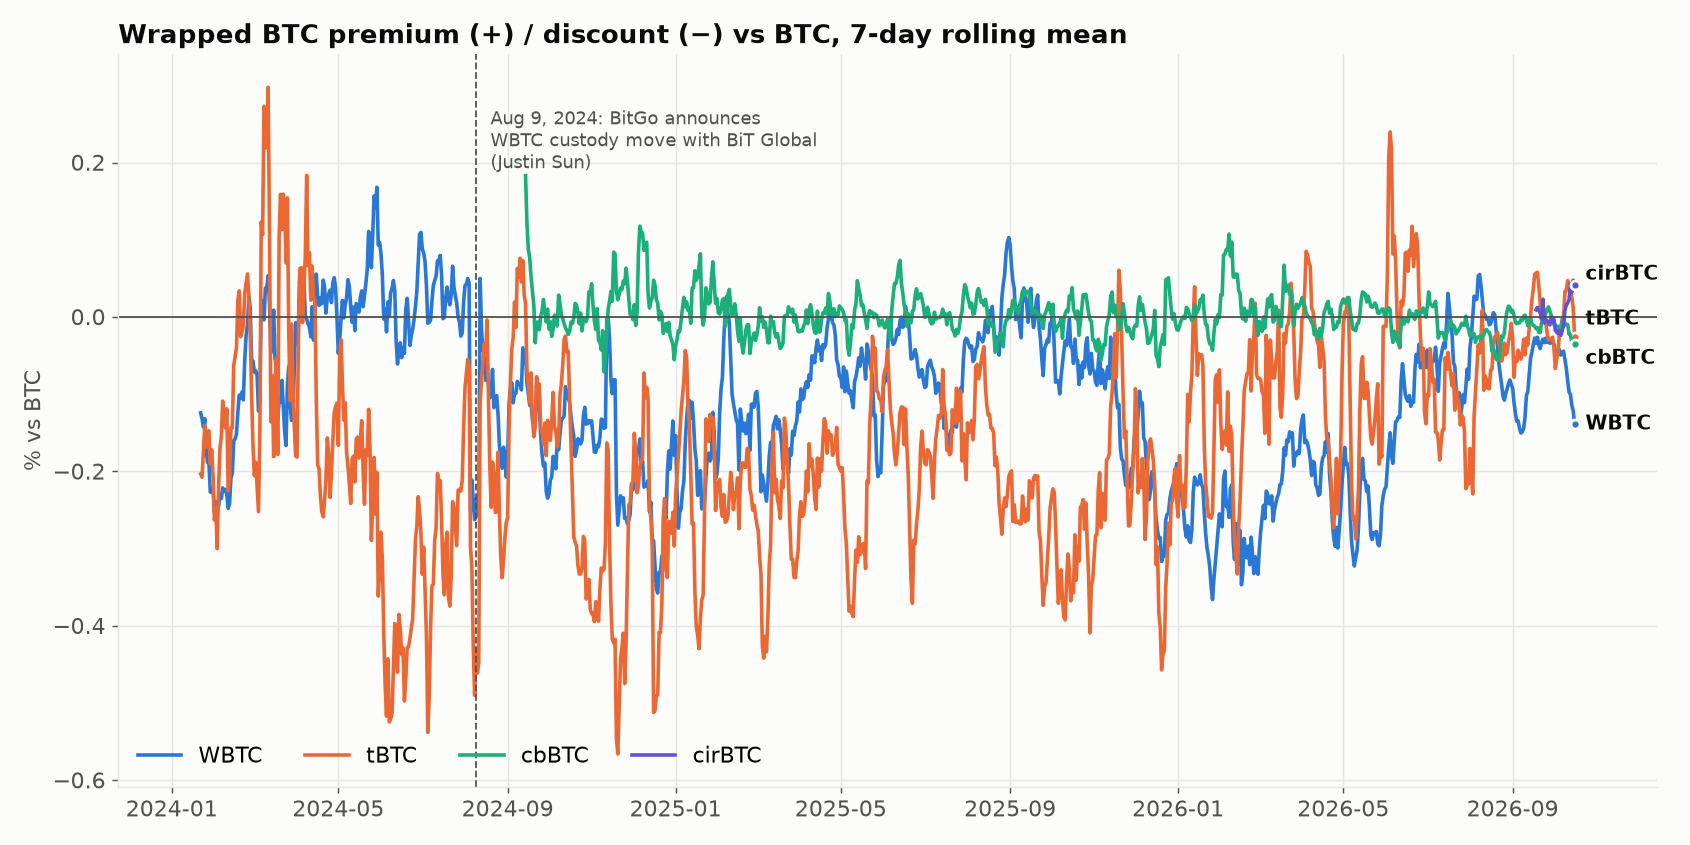
WBTC
WBTC’s DeFiLlama history starts on 20 January 2024. It was already 0.14% to 0.19% below BTC in January and February 2024, then traded slightly above par from April to July.
On 9 August 2024 BitGo announced it would move WBTC custody into a joint venture with Justin Sun’s BiT Global, and the restructuring was completed on 9 October. That’s when I started noticing the discount, and in the data it shows up that month: August 2024 averaged −0.14%. Since then only August and September 2025 were at par, and every other month was negative. The worst stretch was December 2025 to May 2026, with monthly means between −0.19% and −0.29%. It narrowed over the summer (−0.03% in August 2026), and the latest daily reading is −0.27%.
Averaged out, WBTC was 0.03% below BTC before 9 August 2024 and 0.13% below after. Prices can’t tell you whether the custody change caused that, and cbBTC launched a month later, which gave holders an alternative. Either way, WBTC now usually sits a bit below BTC, and cbBTC doesn’t.
cbBTC, tBTC and cirBTC
cbBTC is boring, which is what you want from a wrapped bitcoin. Its 7-day mean rarely leaves ±0.05%, and the only real excursion was in its first days after launch in September 2024.
tBTC is the decentralized one, and it trades at a discount and moves around a lot. It averaged −0.19% before August 2024 and −0.17% after, so whatever happened to WBTC didn’t change tBTC much. Over the last year single days ranged from −0.94% to +0.95%.
cirBTC’s main pool was created on 16 September 2026, so there’s only a month of data. It has been at par with low noise. Its numbers come from a different source than the other three, so small differences may be methodology.
Stablecoins vs their currency
| Token | Peg | Mean | Std dev | Range (daily) | Days more than 0.10% off |
|---|---|---|---|---|---|
| USDC | USD | −0.017% | 0.029% | −0.05% to +0.49% | 0.3% |
| USDT | USD | −0.049% | 0.051% | −0.19% to +0.06% | 19% |
| LUSD | USD | +0.466% | 0.507% | −0.42% to +2.55% | 80% |
| EURC | EUR | −0.052% | 0.049% | −0.20% to +0.11% | 15% |
| EURCV | EUR | −0.076% | 0.056% | −0.25% to +0.12% | 31% |
| ZCHF | CHF | +0.018% | 0.220% | −0.58% to +0.99% | 65% |
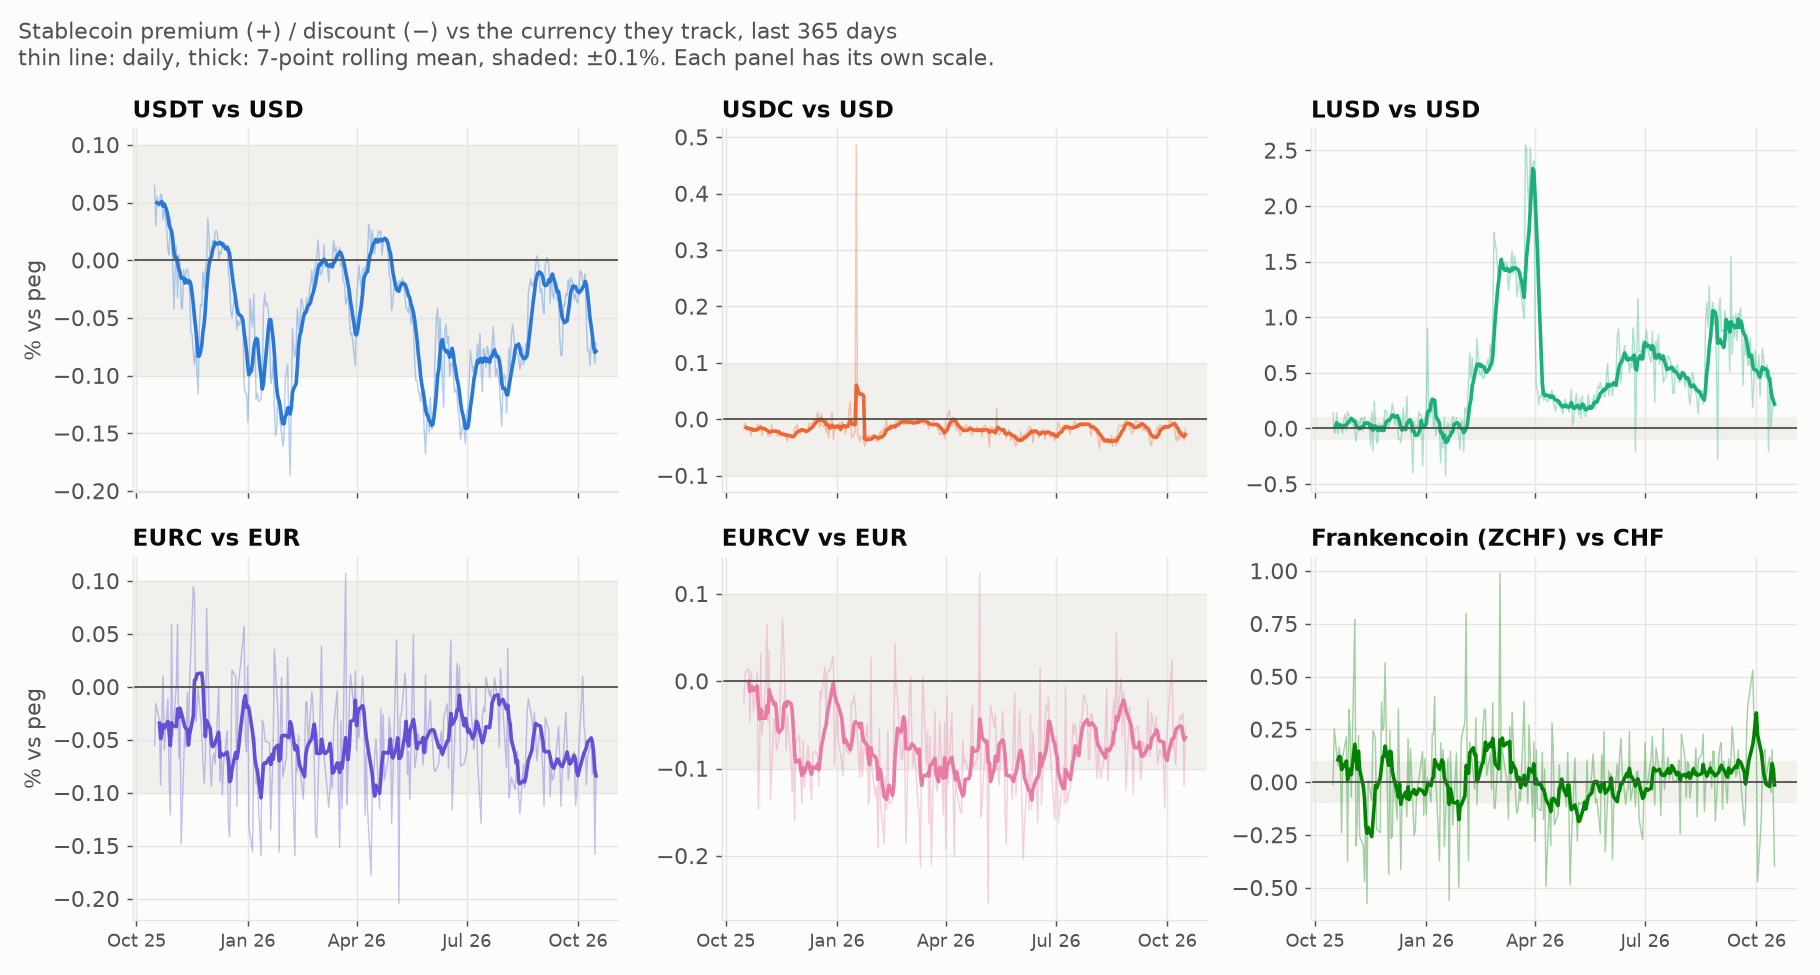
USD: USDC, USDT and LUSD
USDC barely moves. The one exception is 17 January 2026, a single day at +0.49%, which looks like a bad data point rather than a real move because the days around it are normal.
USDT goes through stretches of a few weeks at −0.10% to −0.15% and then comes back to par. June 2026 was its worst month at −0.10% on average. It never broke badly, but selling USDT on a DEX usually got you a few basis points less than selling USDC.
LUSD is the odd one. It’s backed by ETH in Liquity v1, and the protocol only enforces a floor: anyone can redeem 1 LUSD for $1 of ETH. The ceiling is soft: at $1.10 it becomes profitable to open a minimum-collateral loan and sell the LUSD. Between those two levels the price floats, and it spent most of the year above the peg. The monthly mean was +0.62% in February 2026 and +1.61% in March, with a peak of +2.55% on 24 March. That’s nice if you hold LUSD and expensive if you need to buy it.
EUR: EURC and EURCV
Both euro coins sit slightly below the euro most of the time. EURC averaged −0.05% and EURCV −0.08%, and EURCV was more than 0.10% below on almost a third of trading days. Some of this may come from my method (an hourly FX quote against a DEX price), but USDC from the same data source sits closer to par, so I don’t think it’s all method.
EURCV is issued by Société Générale’s crypto arm SG Forge. Being backed by a large bank hasn’t bought it a tighter peg than Circle’s EURC.
CHF: Frankencoin
Frankencoin is collateralized on-chain rather than backed by francs in a bank, and its market is much thinner than the others. On average it’s at par (+0.02%), but its daily readings swing from −0.58% to +0.99%, and it was more than 0.10% off on 65% of trading days. The 7-day mean mostly stays within ±0.2%. For small amounts that’s fine. For larger ones, check the pool depth before you swap.
Caveats
- These are DEX market prices on Ethereum mainnet, not mint and redeem prices. If you can redeem with the issuer, a discount is a trade, not a loss (minus redeem fees).
- One reading per day hides intraday depegs.
- The EUR and CHF figures depend on matching an FX quote to a DEX price taken at a slightly different time, which adds noise.